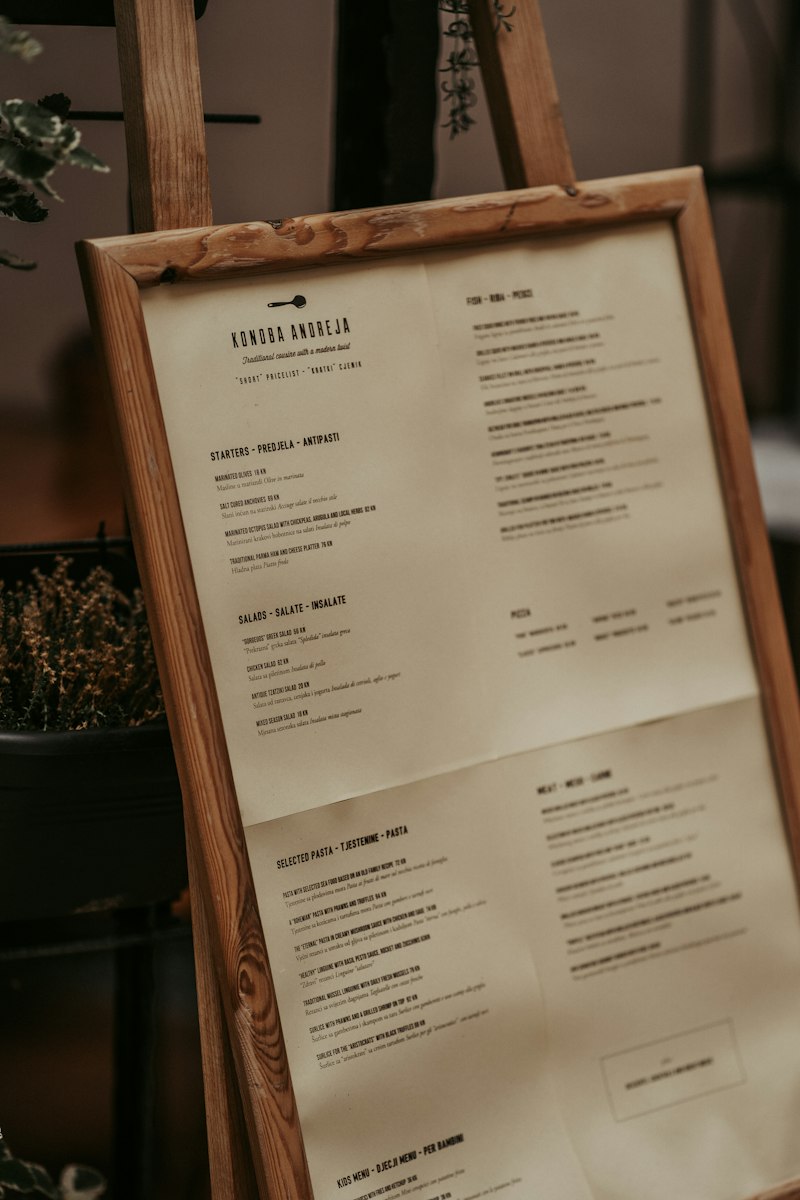
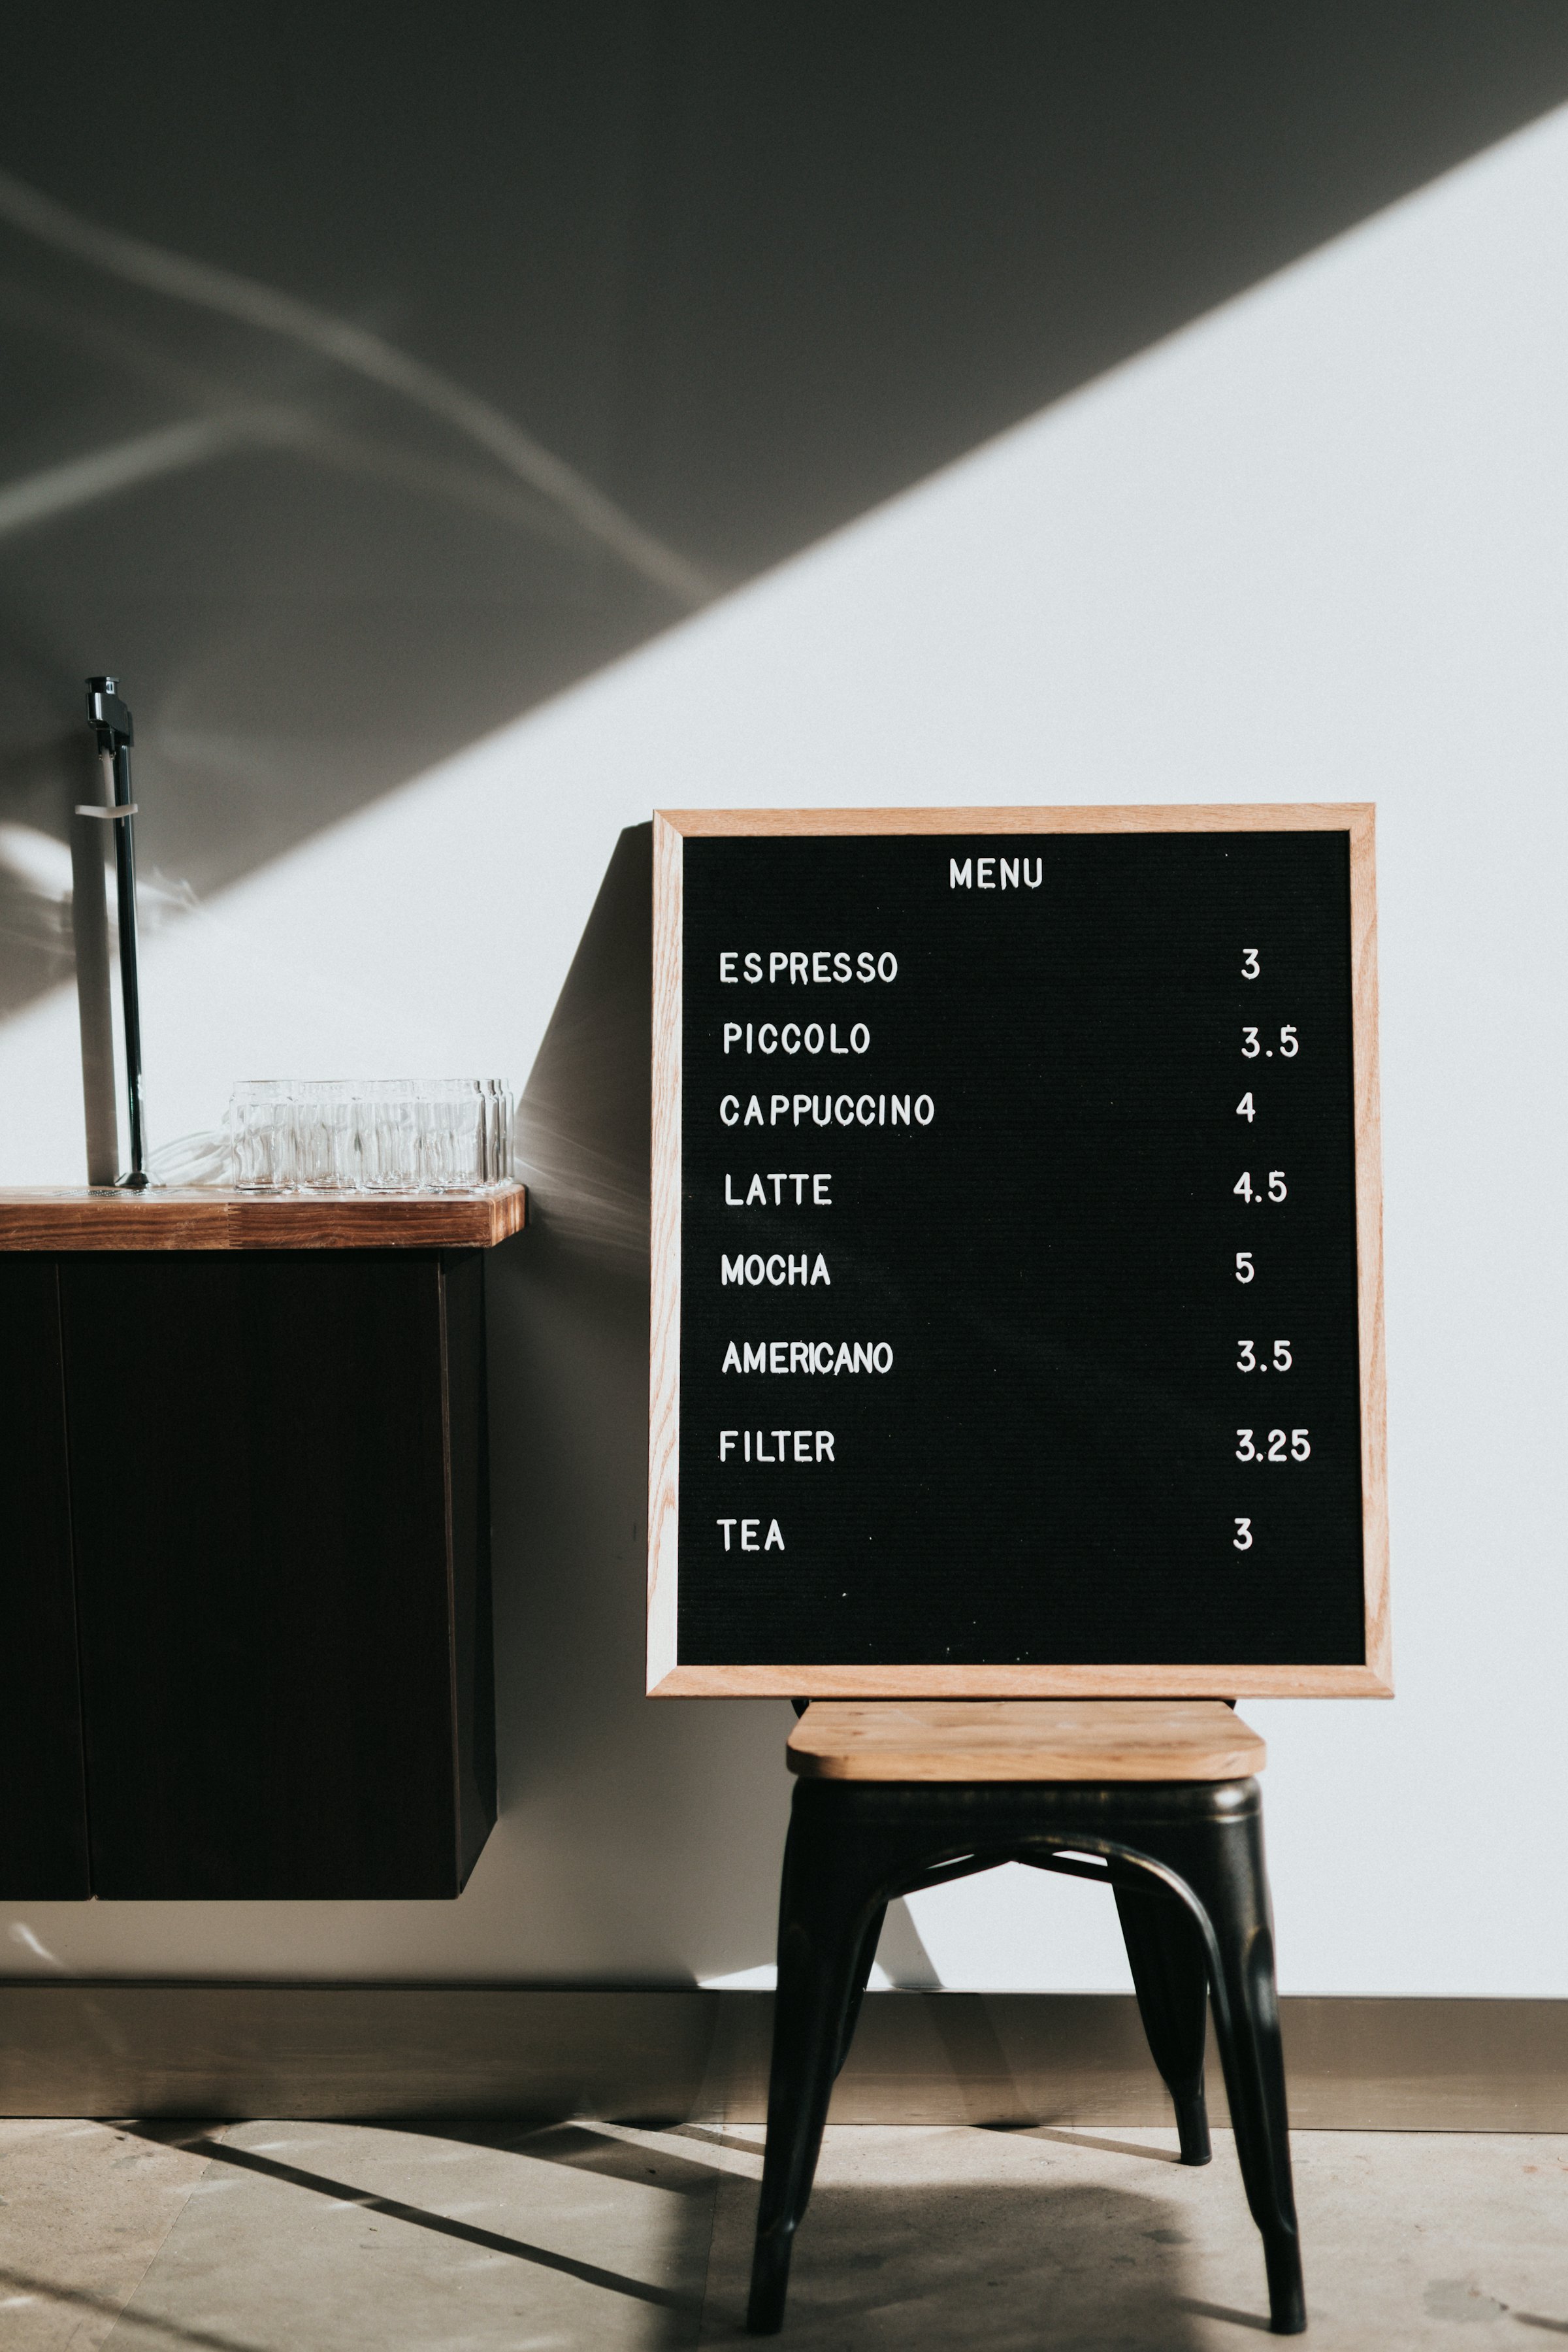
Menus attract plenty of rules: the eye goes top right first, the dots to the price must go, drop the currency sign. Few of them have been properly tested, and many numbers online can’t be traced back to any study. What’s left is less spectacular and more useful.
What does research really show about menus?
Research shows small, limited effects and knocks down a few myths. None of these studies comes from a German restaurant, and hardly any tests a menu on a phone.
| Study | Who and where | Result | Limit |
|---|---|---|---|
| Yang 2012 | 25 people at a US university, eye tracking, two-page dinner menu | People read like a book. No more frequently viewed “sweet spot” was found | Small, lab setting, measures gaze not purchases |
| Dayan and Bar-Hillel 2011 | Café in Tel Aviv, 951 orders, two menu versions for 15 days each | Items at the start or end of a category became more popular, by about 20% in the study | Only 20 items moved, often not significant one by one, waiters recorded orders |
| Yang, Kimes, Sessarego | Student-run restaurant at the Culinary Institute of America, lunch, 201 diners | Plain number with no dollar sign: $5.55 more per check than other formats. The overall format effect wasn’t significant | One place, dollars not euros. Party size and time at the table mattered far more |
| Johns and others 2013 | 443 people at open days at two universities, rating made-up menus | Ideal: about 6 options per category for quick service, 7 to 10 for fine dining | Ratings on paper, no real orders |
| Turnwald and others 2017 | Stanford cafeteria, 27,933 diners, 46 weekdays | 25% more people took vegetables described indulgently than plainly named ones | Vegetables only, one cafeteria, mostly students |
How should you lay out your menu?
Lay the menu out in the order guests eat and decide, and put key dishes at the start or end of a category. Yang found that people read a two-page menu like a book, from top left to bottom right, and likely build their meal around a main dish. The author explicitly urges scepticism about the usual explanations. The lowest areas of each page got fewer looks, though whether that was down to position or content stayed open.
- A sensible order. Breakfast, small plates, mains, sweets, drinks. No clever system guests have to learn first.
- Use the edges of a category. Put what you want to recommend at the start or end, not in the middle. The café experiment supports this, and no more than that.
- Don’t sort by price. A list from cheap to expensive invites comparing prices. That’s experience, not a study, so make your own call.
- Easy to read. Check the type in your evening light, with reading glasses and without.
How many dishes belong on a menu?
It depends on your place, but about 6 to 10 options per category is a good check. That’s how respondents rated it in the study by Johns and others: around 6 for quick service, 7 to 10 for fine dining. A café menu with a short breakfast can be far smaller.
Ask the till first. A dish that barely sells and needs its own ingredients costs you twice: storage, stock and time. The worked example below shows how to spot it.
How do you write descriptions that help?
Good descriptions name flavour and preparation, and everything in them must be true. In the Stanford cafeteria, more people chose the vegetable when it was called “Dynamite chili and tangy lime-seasoned beets” rather than plain “Beets”, though the cooking stayed the same. Healthy-sounding names did no better than the plain one there. We don’t know whether this carries over to your café, and the study itself says that’s an open question.
| Plain | Better (only if true) |
|---|---|
| Beetroot salad | Roasted beetroot with chilli and lime |
| Chicken with rice | Crispy chicken, lemon rice, herb yoghurt |
| Cake of the day | Fresh from the oven today: plum cake with crumble |
Preparation + main ingredient + what makes the flavour. Twelve words at most. Only words you could explain to a guest at the table. “Homemade” and “local” only when they’re really true.
How should prices appear on a menu?
Write prices consistently and as final prices, and don’t expect miracles from the format. In the experiment by Yang, Kimes and Sessarego, a plain number with no dollar sign did bring more per check, but format overall wasn’t a significant factor. Party size and time at the table mattered far more. It wasn’t tested with euros.
The same source reports on older work in which prices ending in 9 seemed better value in quick service, while round prices seemed higher quality in fine dining. That measures how guests rate a place, not what they buy. So match the ending to your place, and don’t count on much effect.
In Germany, as of November 2026, these rules apply to the prices themselves:
- Prices include service charges and all surcharges.
- “From”, “about” and price ranges are not allowed, says the Dortmund Chamber of Commerce, and drinks need their quantity.
- Under section 6 of the Restaurant Act (Gaststättengesetz), at least one alcohol-free drink may not cost more than the cheapest alcoholic drink, also compared per litre.
The full list is in what must be on a menu in Germany.
How do you price a menu item?
Go from food cost, through your target share, to a net price, add VAT and round to a sensible menu price. Under section 12 of the German VAT Act, restaurant and catering services are at 7% and drinks at 19%. Other countries have other rates. The example is made up, and the 30% and 20% are assumptions, not industry rules. Use your own targets.
| Step | Main dish, Restaurant Laterne | Homemade lemonade, Restaurant Laterne |
|---|---|---|
| Food or drink cost per portion | €4.80 | €0.90 |
| Assumed share of net price | 30% | 20% |
| Net price (cost divided by share) | €16.00 | €4.50 |
| VAT | 7% | 19% |
| Gross price | €17.12 | €5.36 |
| Menu price after rounding | €17.50 | €5.50 |
| Net price from the menu price | €16.36 | €4.62 |
| Contribution margin (net minus cost) | €11.56 | €3.72 |
Contribution margin is what’s left per portion for staff, rent and profit. Always calculate net, because VAT isn’t yours to keep. Then compare with places nearby and ask whether guests would pay that price for this plate. For tax questions, ask your tax adviser.
What is menu engineering, and how do you do it?
Menu engineering sorts each dish by popularity and contribution margin into four groups, so you can see what stays, what should change and what can go. The model comes from Michael Kasavana and Donald Smith, around 1982. A dish counts as popular if it reaches at least 70% of an equal share of sales and as high-margin if its contribution margin is at least the weighted average.
Here’s a made-up example with six dishes and 600 portions in a month. The popularity line is 600 divided by 6, times 0.7, which is 70 portions. The average contribution margin is the total of €5,545 divided by 600, which is €9.24.
| Dish | Portions | Margin | Group | What you do |
|---|---|---|---|---|
| Schnitzel | 170 | €11.00 | Star: popular, high margin | Keep, protect the quality |
| Salad | 100 | €10.00 | Star: popular, high margin | Keep |
| Burger | 150 | €7.00 | Plowhorse: popular, low margin | Check buying and portion, adjust price carefully |
| Salmon | 60 | €14.00 | Puzzle: little demand, high margin | Description, place in the category, team recommendation |
| Risotto | 65 | €7.00 | Dog: little demand, low margin | Rework or remove |
| Flatbread | 55 | €6.00 | Dog: little demand, low margin | Rework or remove |
Look at the burger: 50 cents more margin would be €75 a month at the same 150 portions. Whether portions hold is the open question, so change one thing and watch for a month.
The model has limits. It only knows sales and food cost, not kitchen effort. And a “dog” may be the only vegan dish that a whole group comes in for. Let the model do the sums and make the decision yourself. A dish your regulars order every week doesn’t go because of a table.
What about photos and menus on phones?
Photos have to show the real plate, and on a phone, scrolling and legibility count for more than any placement. In two online experiments at Ohio State University with 267 and 222 participants, food photos with stronger colours looked fresher and tastier and raised purchase intent. Those were imagined orders from made-up restaurants, not real sales. For you, that means good light and true colours, and no pictures that promise more than the plate.
Nearly all the studies above used paper, and a phone has no two pages and no top right. There, short categories, a search and the most popular dishes near the top help guests most. Our guide on creating a digital menu covers how. For getting it to the table, read about the QR code menu.
How do you do this on a phone without rebuilding everything?
With NFCeez it works like this. You take photos of your existing menu in the app or upload it as a PDF, and the AI sorts dishes, prices and categories. If you want, it writes a description for every dish, which you check against the template above: is every word true? Guests see Popular, your categories and a search. If a dish has no photo, the AI can make one, and guests see a mark saying it’s an AI photo. Your own photos of the real plate work any time. After your menu engineering round, you change the price in the app and publish, with no reprint. The app also shows what guests searched for in your menu and didn’t find, such as gluten-free.
The limit: NFCeez doesn’t know your portions sold or food cost, because it isn’t connected to your till. You still do the sums above with the figures from your till. The digital menu page shows what it looks like.
What do you do first?
Your next step: pull the portions sold in the last 30 days from your till, add the contribution margin for ten dishes, and see which one you should describe differently, move or remove first.
How NFCeez does thisA new price, with no reprint.The AI turns your menu into a phone version with Popular, categories and search. You change prices and descriptions in the app and see what guests search for and don’t find.See how it works- Yang (2012): Eye movements on restaurant menus, International Journal of Hospitality Management 31
- Dayan, Bar-Hillel (2011): Nudge to nobesity II, Judgment and Decision Making 6(4)
- Yang, Kimes, Sessarego: Menu price presentation influences on consumer purchase behavior in restaurants
- Cornell Chronicle: Diners spend more when menus don't use dollar signs
- Johns, Edwards, Hartwell (2013): Menu Choice: Satisfaction or Overload?, Journal of Culinary Science and Technology 11(3)
- Turnwald, Boles, Crum (2017): Association Between Indulgent Descriptions and Vegetable Consumption, JAMA Internal Medicine
- Ohio State University: How color in photos can make food look tastier (Journal of Business Research, 2022)
- Menu engineering, Wikipedia (Modell nach Kasavana und Smith, 1982)
- Kasavana (2025): The Power of Menu Engineering, AHLEI
- Umsatzsteuergesetz, § 12
- Preisangabenverordnung, § 13
- IHK Dortmund: Preisangaben im Gaststättengewerbe
- Gaststättengesetz, § 6